Weather & climate visualisation beyond my polar and travel design work Under construction, coming soon!
Global
Where the climate fits a brief
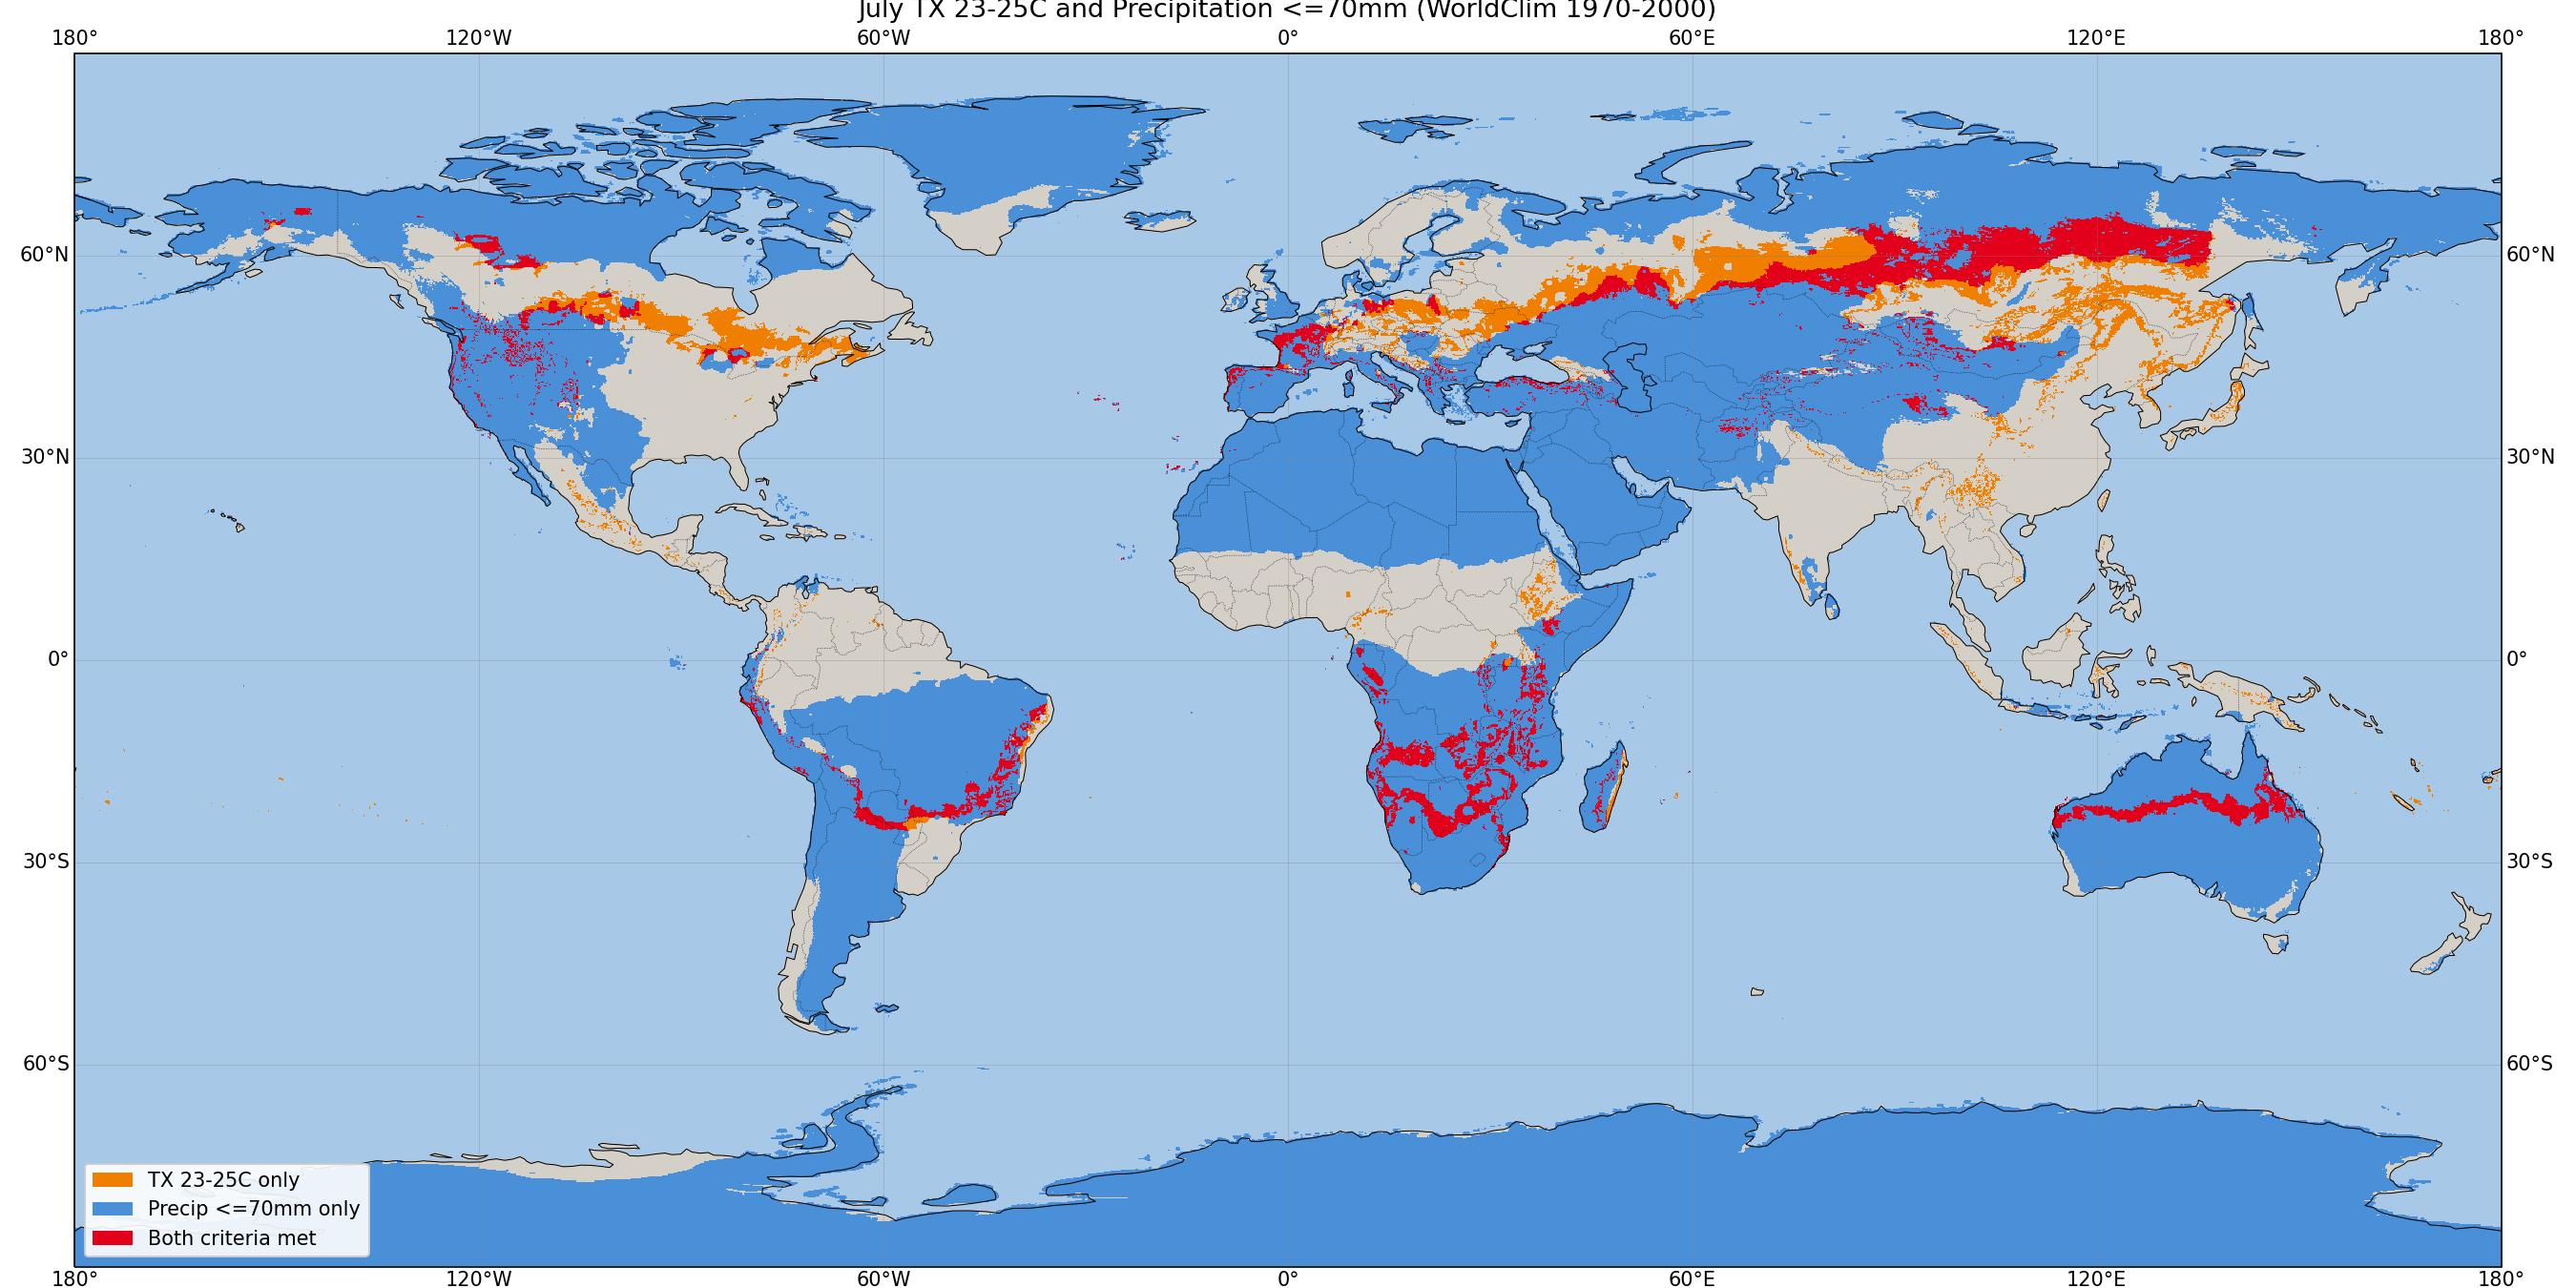
Using WorldClim and ERA5 to find the regions of the world that meet specific July temperature and precipitation criteria — gridded layers overlaid into a single map
Global July climate zone overlap
Regions meeting set July maximum temperature and precipitation thresholds, produced by overlaying gridded climate layers.